Prometheus-基础
Prometheus
Prometheus是一个开源系统监控和警报工具包,最初在 SoundCloud构建。自 2012 年成立以来,许多公司和组织都采用了 Prometheus,该项目拥有非常活跃的开发者和用户社区。它现在是一个独立的开源项目,独立于任何公司维护。为了强调这一点,并明确项目的治理结构,Prometheus 于 2016 年加入 云原生计算基金会,成为继Kubernetes之后的第二个托管项目。
Prometheus主要特点
- Prometheus使用的是度量(metric)名称和键/值对标签(label)的时间序列数据,是一种多维的数据模型
- PromQL是一种灵活的查询语言,可以利用度量(metric)名称和标签进行查询、聚合
- 不依赖于分布式存储,单个Prometheus服务也是自治理的
- 使用基于HTTP的拉(pull)模型进行时间序列的数据收集
- 同时也支持通过一个中间网关(pushgateway)来推送时间序列
- 目标对象(主机)是通过静态配置或者服务发现来添加的
- 支持多种图形模式和仪表盘
Prometheus组件
Prometheus目前已经是一个生态系统,具有众多的可选组件
- Prometheus Server本身用于抓取并存储时间序列数据
- 客户端程序库用于检测各种编程语言编写的程序代码
- pushgateway用于支持短生命周期(short-lived)的作业(job)
- 可以针对不同的服务提供对应的导出器(exporters)用于采集度量对数,如HAproxy、MySQL等服务
- 用于告警的alertmanager组件
- 各种支持工具
Prometheus架构以及应用场景
此图说明了 Prometheus 的架构及其一些生态系统组件:
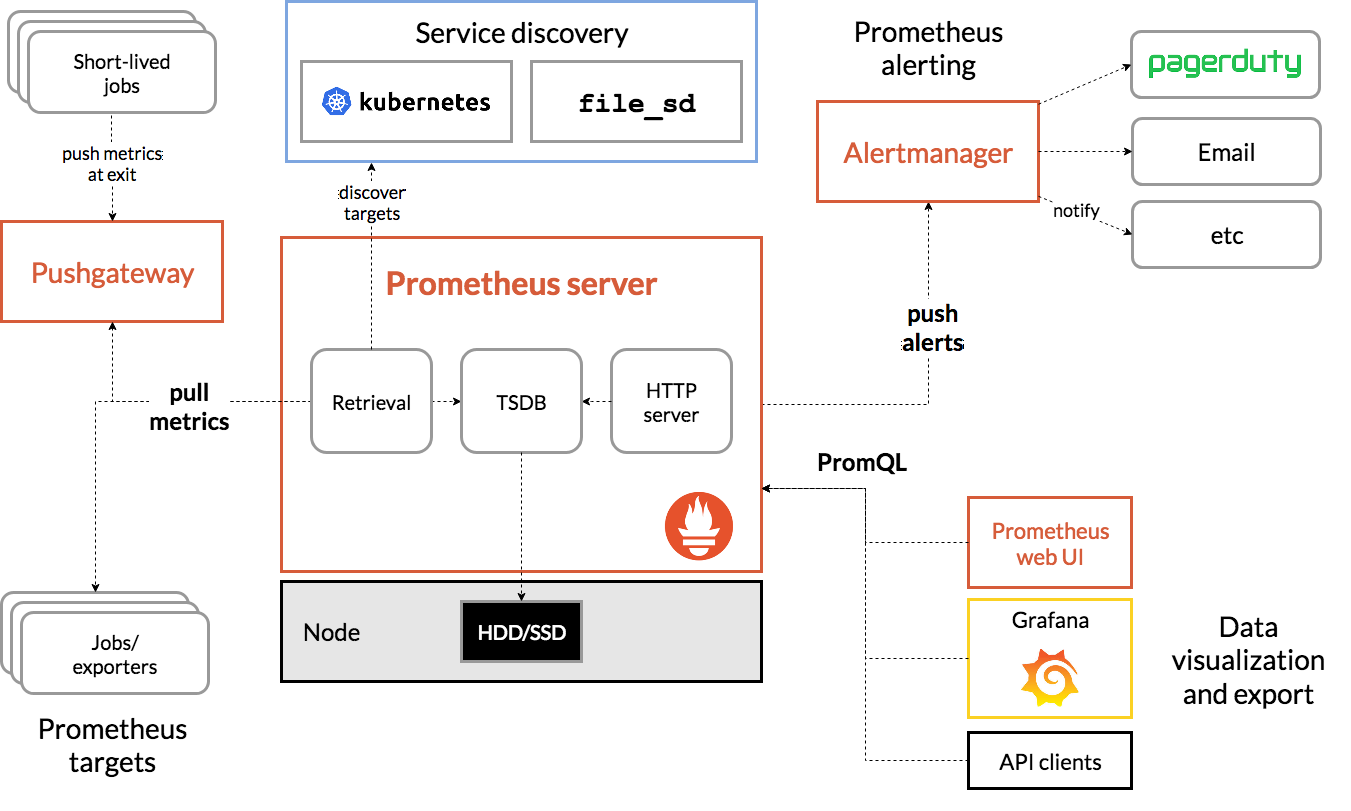
Prometheus 从检测作业中直接或通过中间推送网关从短期作业中抓取指标。它在本地存储所有抓取的样本,并对这些数据运行规则,以从现有数据聚合和记录新的时间序列或生成警报。Grafana或其他 API 使用者可用于可视化收集的数据。
Prometheus 可以很好地记录任何纯数字时间序列。它既适合以机器为中心的监控,也适合监控高度动态的面向服务的架构。在微服务的世界中,它对多维数据收集和查询的支持是一个特殊的优势。Prometheus 专为可靠性而设计,是您在中断期间可以使用的系统,可让您快速诊断问题。每个 Prometheus 服务器都是独立的,不依赖于网络存储或其他远程服务。当您的基础设施的其他部分损坏时,您可以依赖它,并且您无需设置大量基础设施即可使用它。
Prometheus将其可以拉取指标的来源成为endpoint(端点),endpoint可以是各种exporter(导出器)或者应用程序。然后,为了拉取endpoint里的数据,Prometheus定义了名为target(目标)的配置,告诉拉取时要如何进行连接等信息,多个具有相同功能角色的target组合在一起就构成了一个job(作业)。例如,具有相同用途的一组主机的资源监控器(node_exporter),又或者是MySQL数据库监控器(mysqld_exporter)
Prometheus默认是将收集到的时间序列存储在本地TSDB数据库中,且默认只保留15天,也可以配置发送到其他时间序列数据库中。
安装并配置Prometheus
Prometheus官方下载地址:https://prometheus.io/download/
1 | wget https://github.com/prometheus/prometheus/releases/download/v2.36.1/prometheus-2.36.1.linux-amd64.tar.gz |
Prometheus的配置文件是YAML格式,大致分为4大部分:global、alerting、rule_files、scrape_configs
1 | # my global config |
配置Prometheus启动
1 | tee > /usr/lib/systemd/system/prometheus.service << EOF |